Elastic Stack (formerly ELK) - Kibana (part 1)
Kibana is the web UI to visualize data in the data store called Elasticsearch. It’s the user facing component in the Elastic Stack, formerly called ELK stack. This post is based on previous posts which show the basics of Logstash and Elasticsearch and will talk about a few ways how Kibana can help you make sense out of your logs.
| Date | Change description |
|---|---|
| 2018-05-25 | The first release |
Intro
This is the fourth part of a series about the Elastic Stack. As said at the beginning Kibana [1] is on top of Elasticsearch and Logstash. To get the most out of this post, it’s advisable to read the previous posts in this series:
- Elastic Stack (formerly ELK) - Elasticsearch
- Elastic Stack (formerly ELK) - Logstash (Part 1)
- Elastic Stack (formerly ELK) - Logstash (Part 2)
If you already know that content, here we go.
A short recap
The environment I’ve build for this post, consists of 3 virtual machines:
es1as host of the Elasticsearch servicels1as host of the Logstash service and the example applicationkb1as host of the Kibana service
Note
One virtual machine would have been good enough for demo purposes. I’ve chosen to use 3, because I wanted to know how tricky the configuration of the remote connection to the depending services will be. It turns out, it’s fairly easy.
The example application looks like this:
1 2 3 4 5 6 7 8 9 10 11 12 13 14 15 16 17 18 19 20 21 22 23 | #!/usr/bin/env python
import logging
logging.basicConfig(format='%(asctime)s %(levelname)s '
'%(process)d %(thread)d '
'%(name)s %(funcName)s %(lineno)s '
'%(message)s',
level=logging.DEBUG,
filename="/var/log/example-app/example.log")
logger = logging.getLogger('example')
def do_something():
logger.debug('I did something!')
def main():
logger.info('Started the application.')
do_something()
if __name__ == '__main__':
main()
|
The log entries created by this example app will be processed by Logstash and dissected into smaller parts by this pipeline configuration:
1 2 3 4 5 6 7 8 9 10 11 12 13 14 15 16 17 18 19 20 21 22 23 24 25 26 27 28 29 30 31 32 33 34 | input {
file {
id => "example-in"
path => "/var/log/example-app/example.log"
start_position => "beginning"
sincedb_path => "/dev/null"
}
}
filter {
dissect {
mapping => {
"message" => "%{time} %{+time} %{level} %{pid} %{thread} %{loggername} %{function} %{line} %{msg}"
}
remove_field => [ "message" ]
convert_datatype => {
line => "int"
pid => "int"
thread => "int"
}
}
date {
match => [ "time", "ISO8601" ]
remove_field => [ "time" ]
}
}
output {
elasticsearch {
id => "example-out"
hosts => ["http://es1:9200"]
index => "example"
}
}
|
The Elasticsearch Index example here is the one we will use in Kibana later.
Set up the environment
To reproduce the steps in this post, you need to have installed locally:
After these prerequisites are fulfilled:
- download the compressed
project source files. - extract the archive
- change to the
envdirectory - start the Vagrant setup
1 2 3 4 | $ wget http://www.markusz.io/_downloads/elastic-stack-elk-kibana-part1.tar.gz
$ tar -zxvf elastic-stack-elk-kibana-part1.tar.gz
$ cd env
$ vagrant up # does also all of the installation
|
Note
After you decided that you don’t need this environment anymore,
you can remove it with vagrant destroy -f
After this is fully done, all services are up and running, and the example application got executed once, so that we have some data to query.
Set up the index
Open your browser and point it to http://192.168.73.13:5601 and you
should be greeted with this:
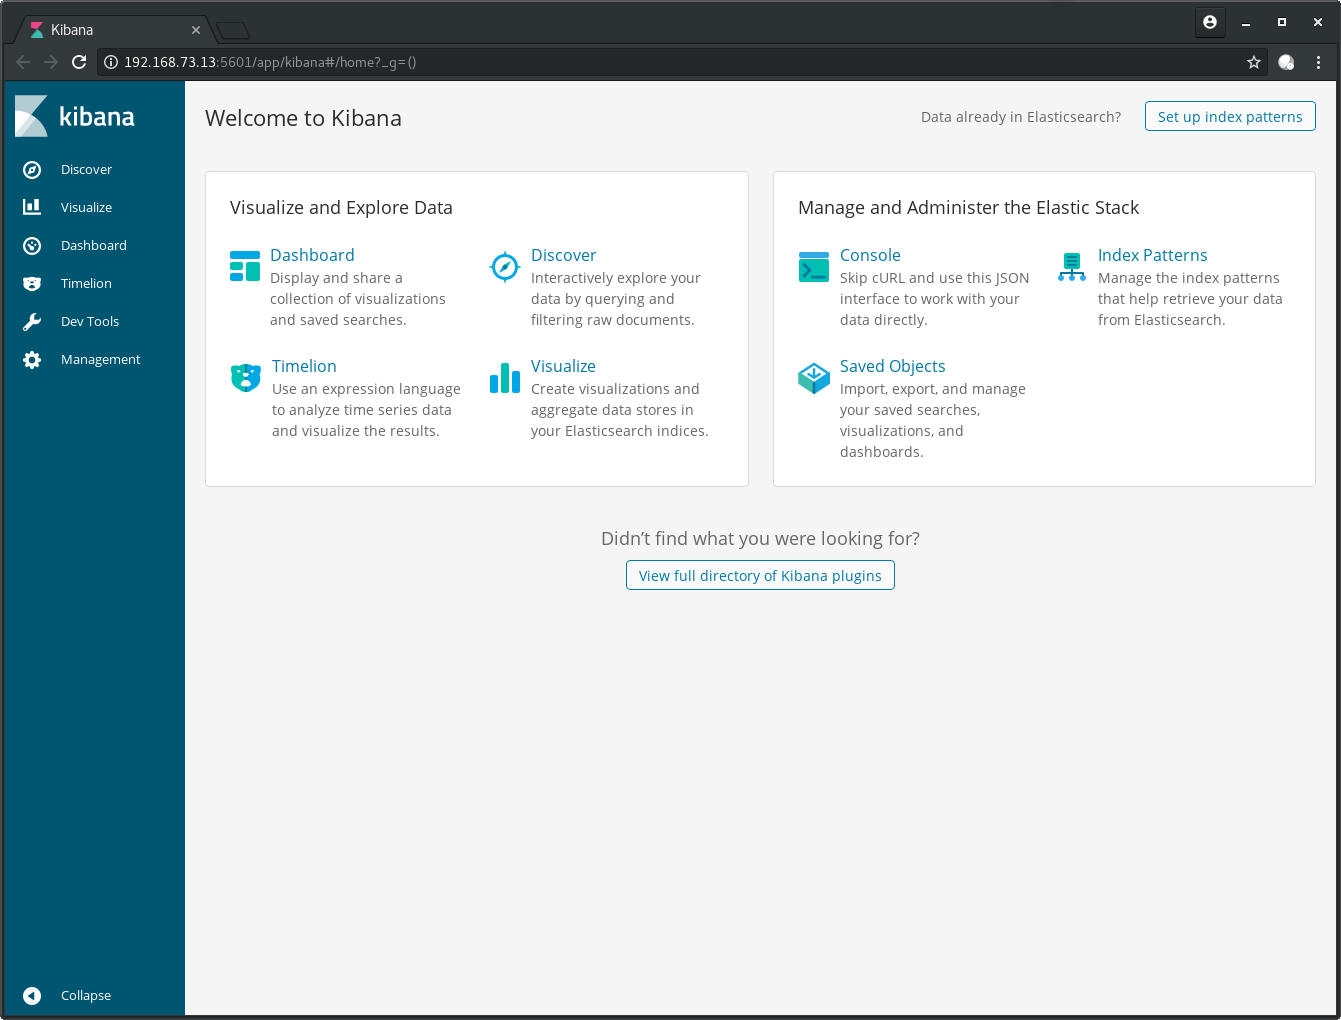
Click the button Set up index patterns in the top right corner,
to make Kibana aware of the index example we created in Elasticsearch during the
setup of the environment.
Enter example in the text field below Index pattern:
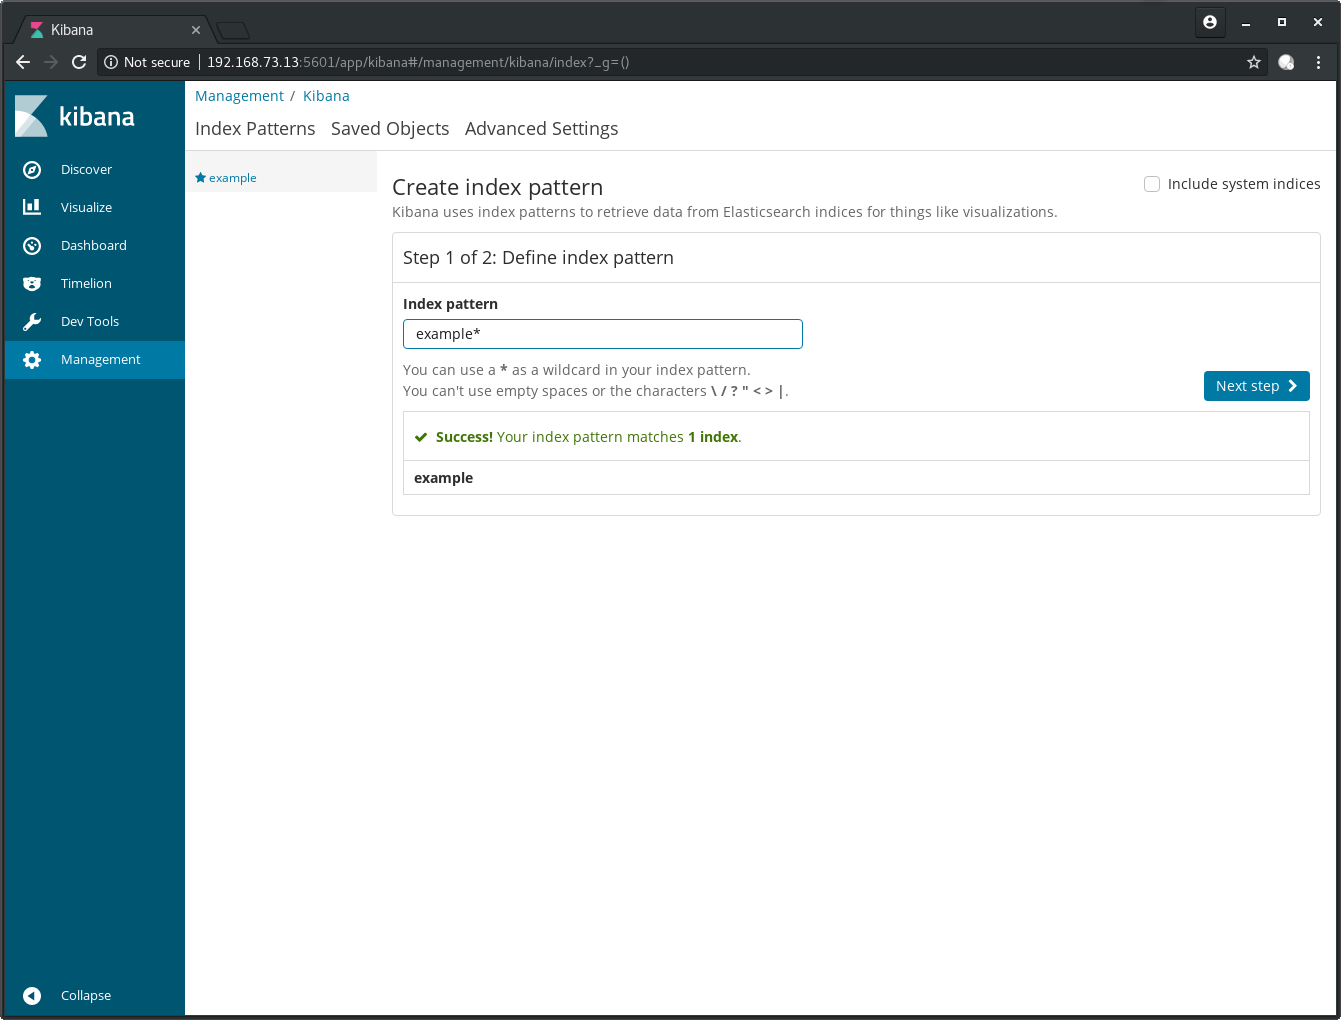
After a click on Next step you need to chose the
@timestamp filed for Time Filter field name:
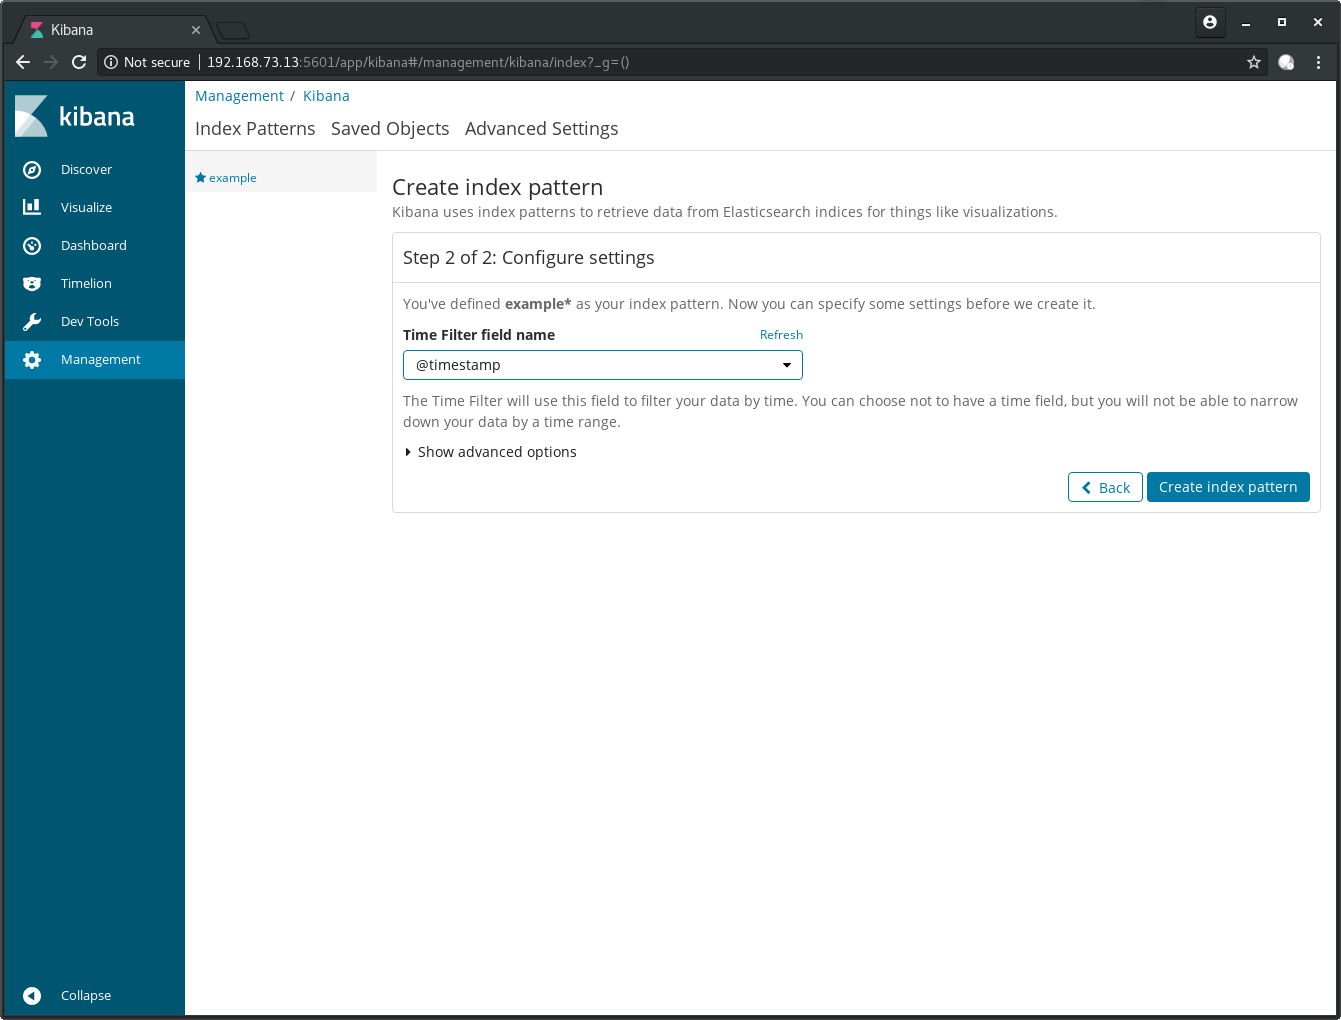
After a click on Create index pattern you have the option to do some fine tuning:
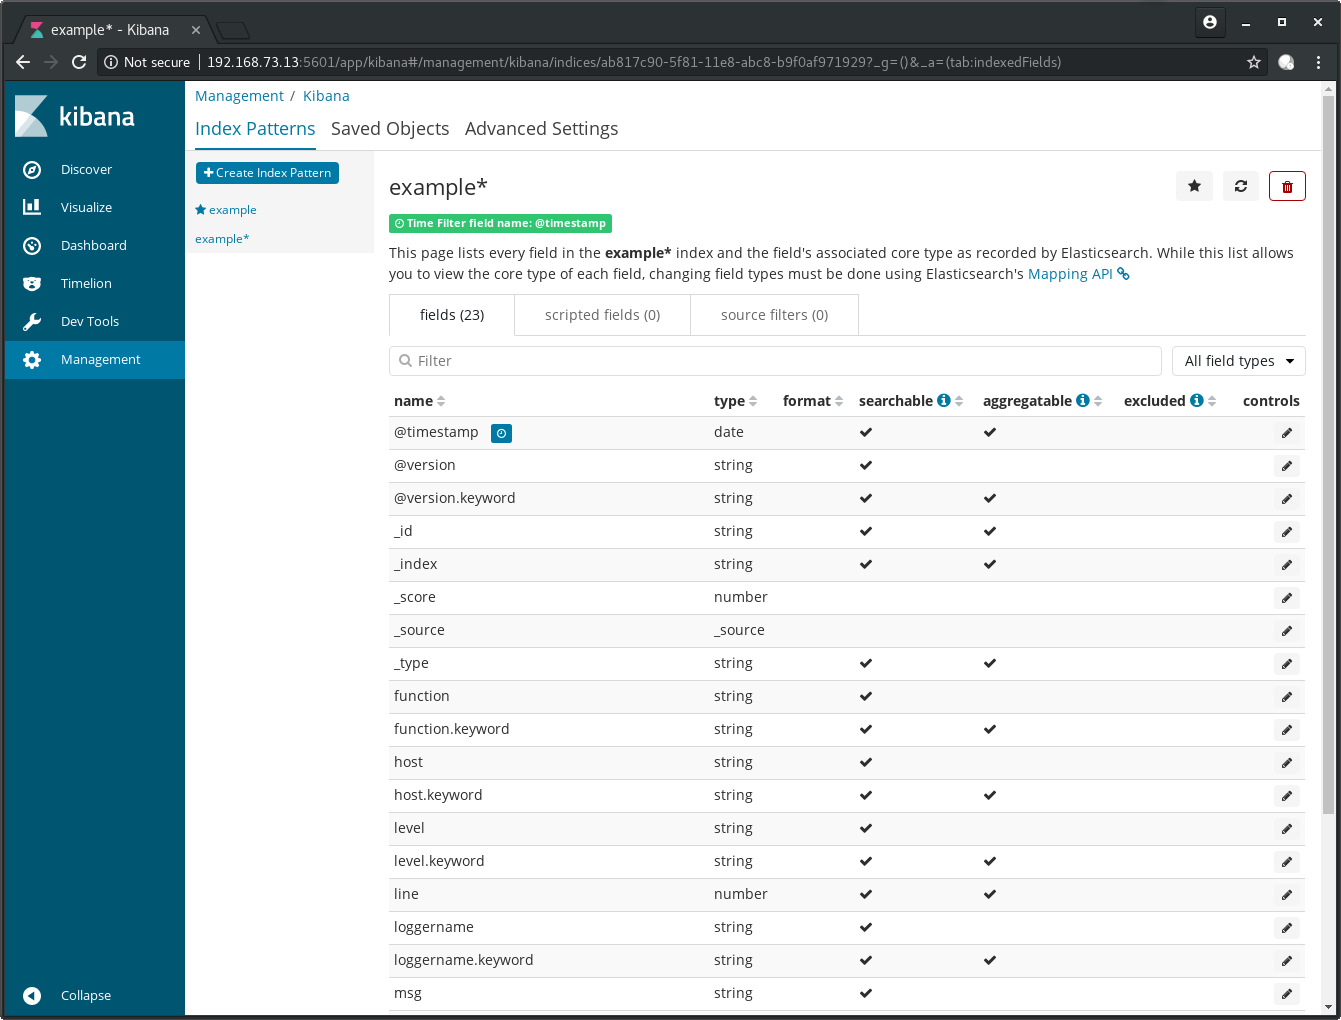
We will ignore that in this post. It’s worth mentioning though, that
the data types we specified in the Logstash pipeline before gets recognized
here. See at the field line for example, which is a number and not
a string.
Discover your data
After the index is setup, we can start to query our logs. Click on Discover on the left panel and adjust the time range on the top right to Today:
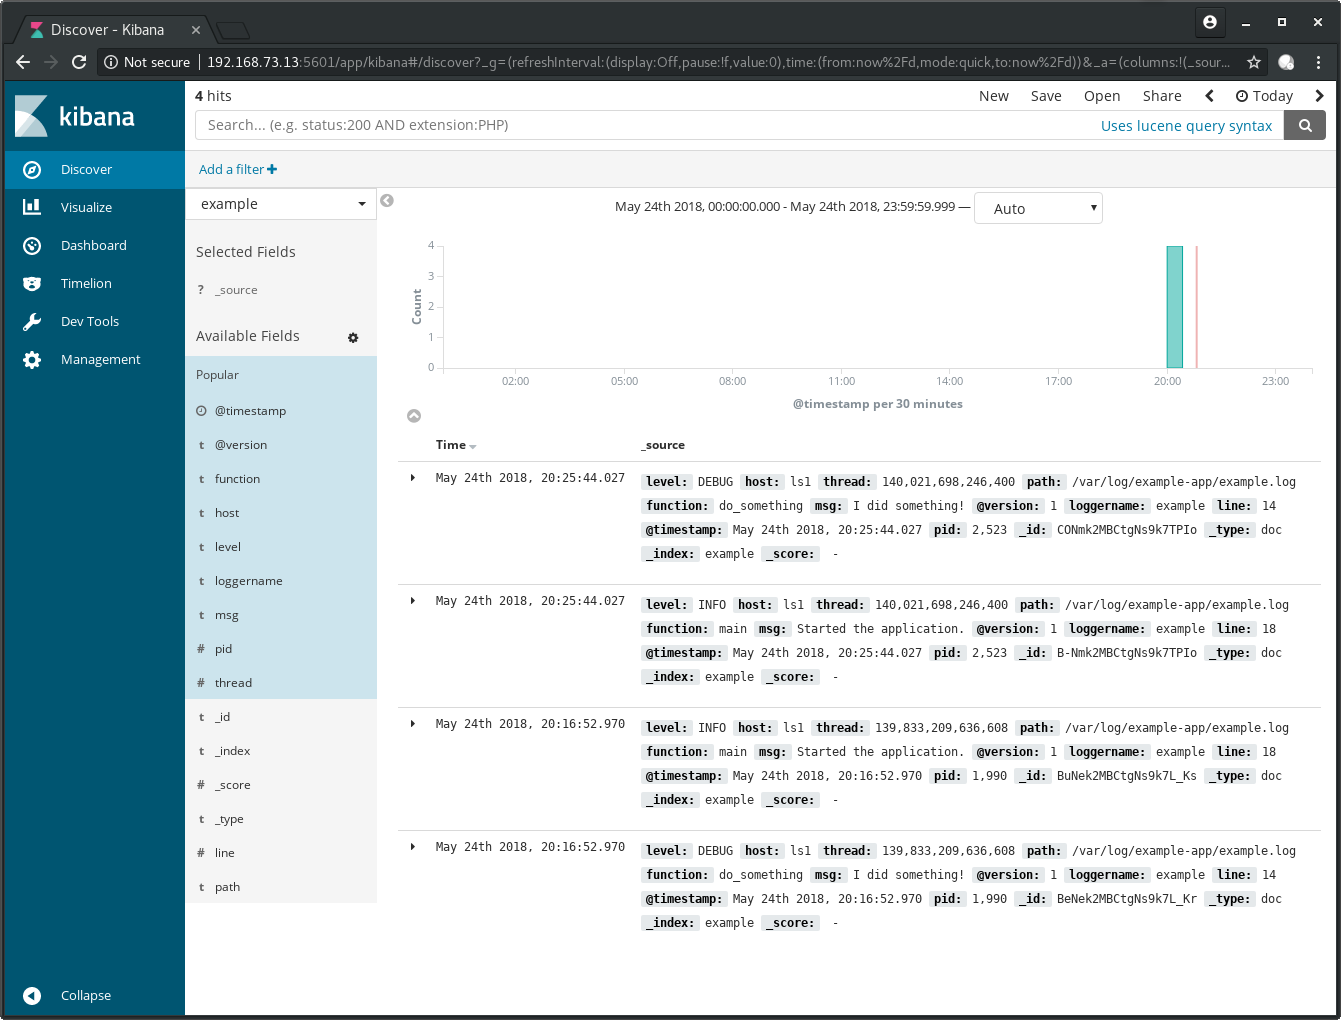
Note
I’ve created more log entries by logging into the server with
vagrant ssh ls1 and executing the example application with
/opt/example-app/example.py, that’s why I have more entries
here in this screen.
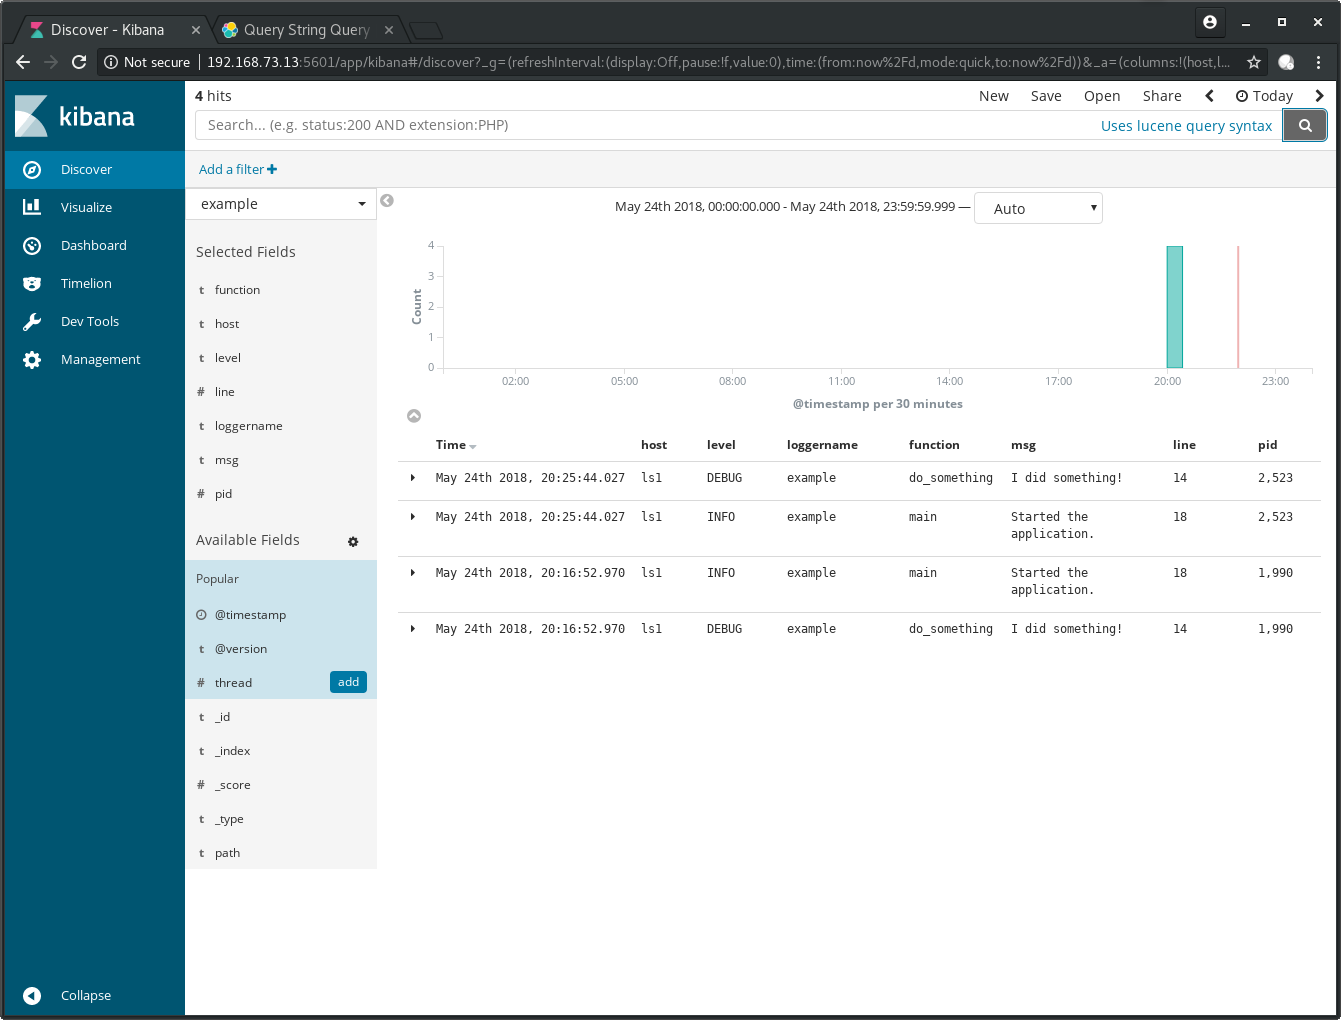
Go to the left hand side, below Available Fields and click on the add button which appears when you hover with your cursor above the fields:
- host
- level
- loggername
- function
- msg
- line
- pid
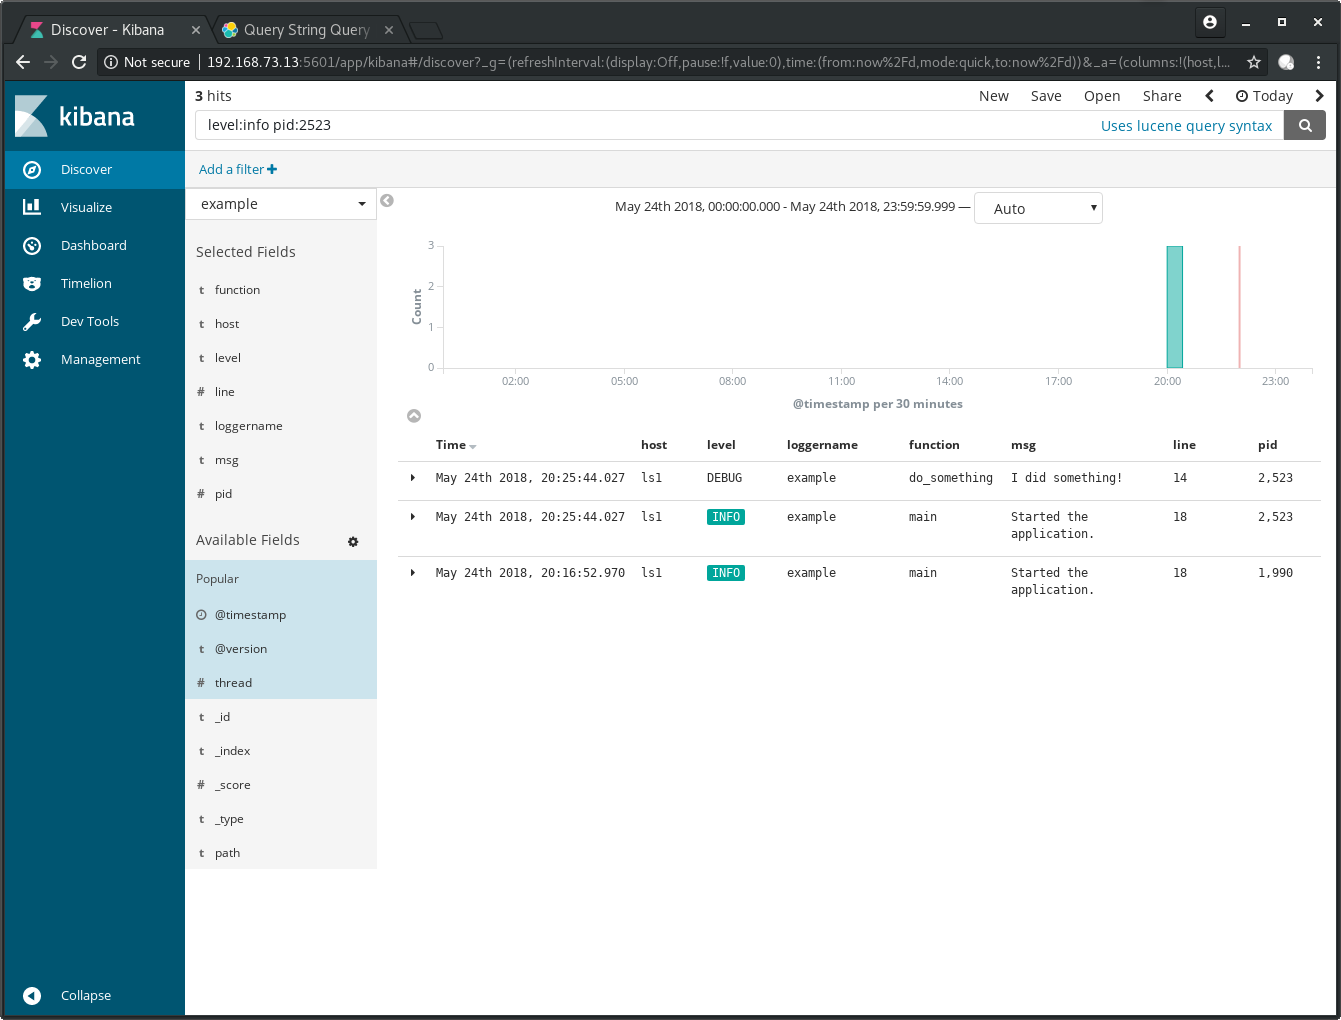
Let’s use the Lucene query syntax [4] to do some searches.
Important
Be aware that the default operator of the Lucene query syntax is the OR operator. I was confused at first, because I thought it was the AND operator.
Enter level:info pid:2523 into the search bar and hit the search button
and you will see that these terms get joined with OR:
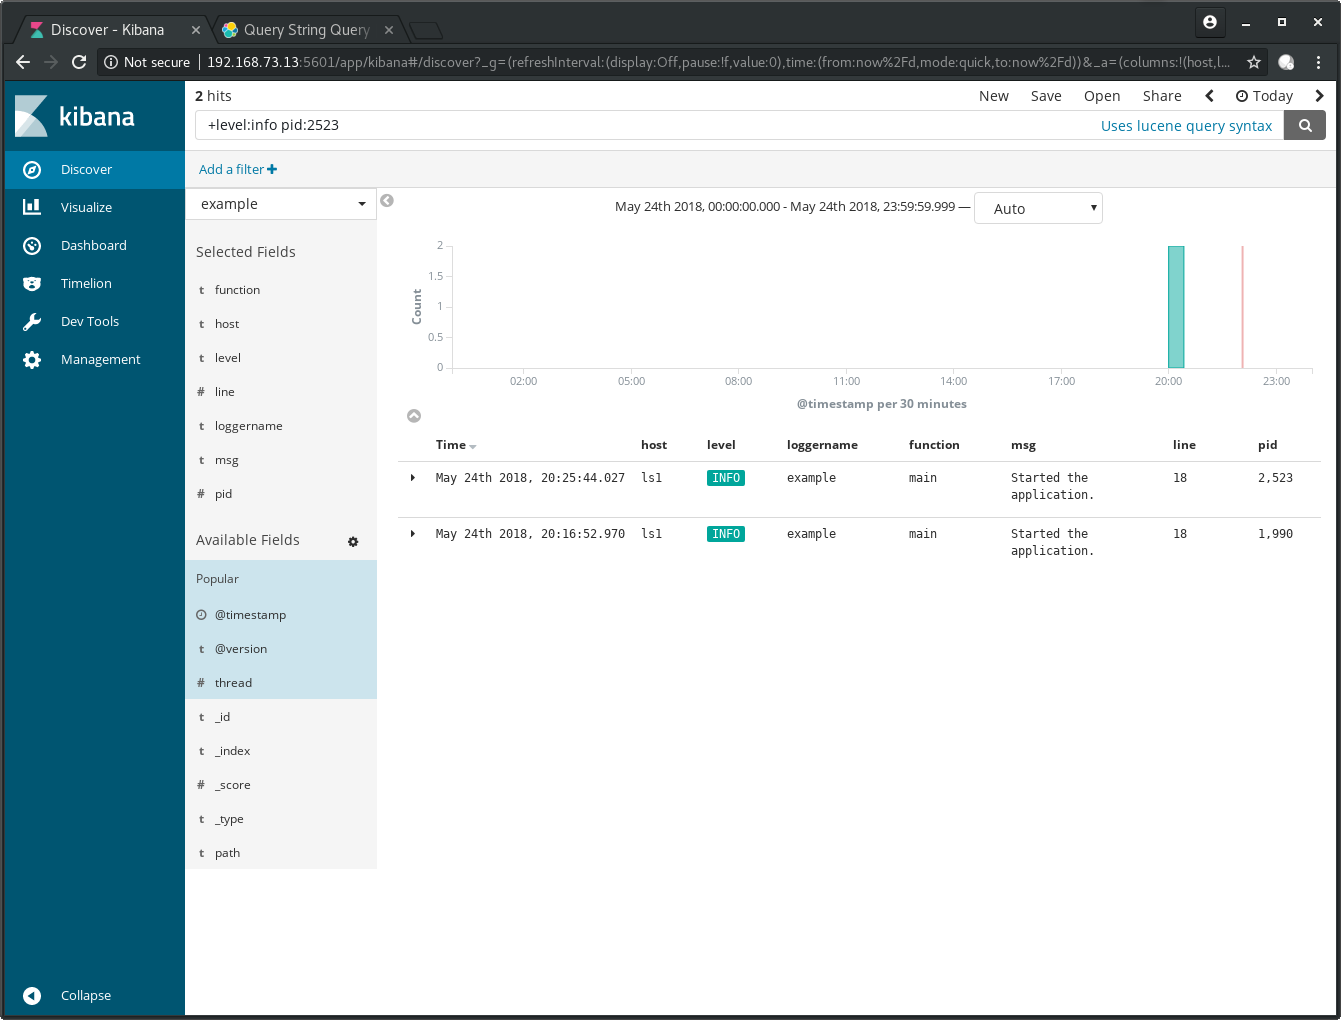
Add the plus symbol in front of the field name to specify that it must
be in the result set. Enter +level:info pid:2523 and search again:
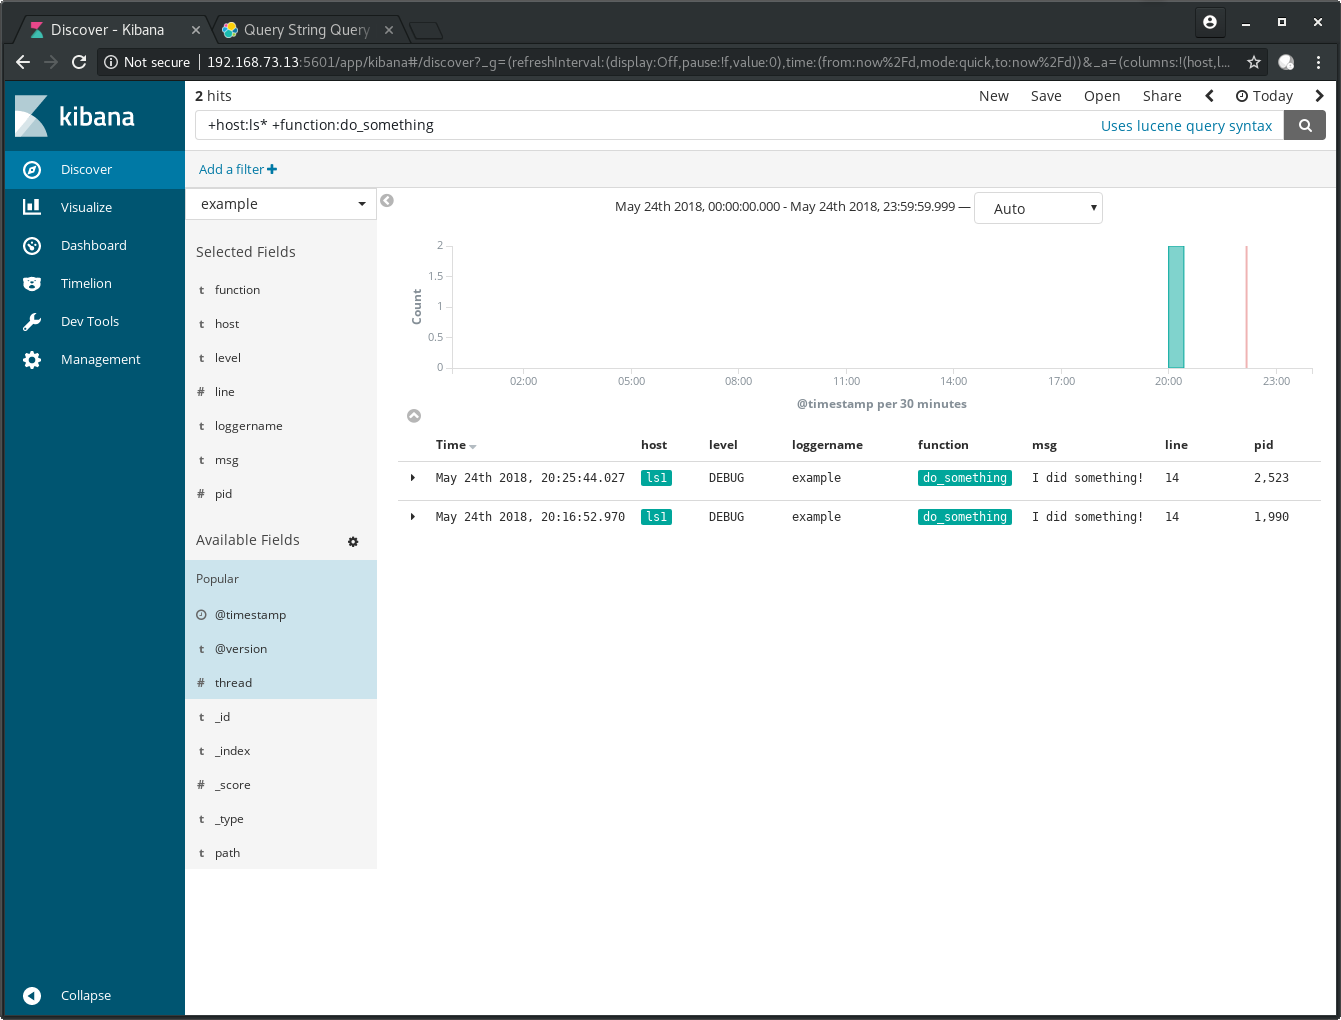
Wildcard searches are possible too. Use the query
+host:ls* +function:do_something to search for logs of all hosts
which start with the name ls:
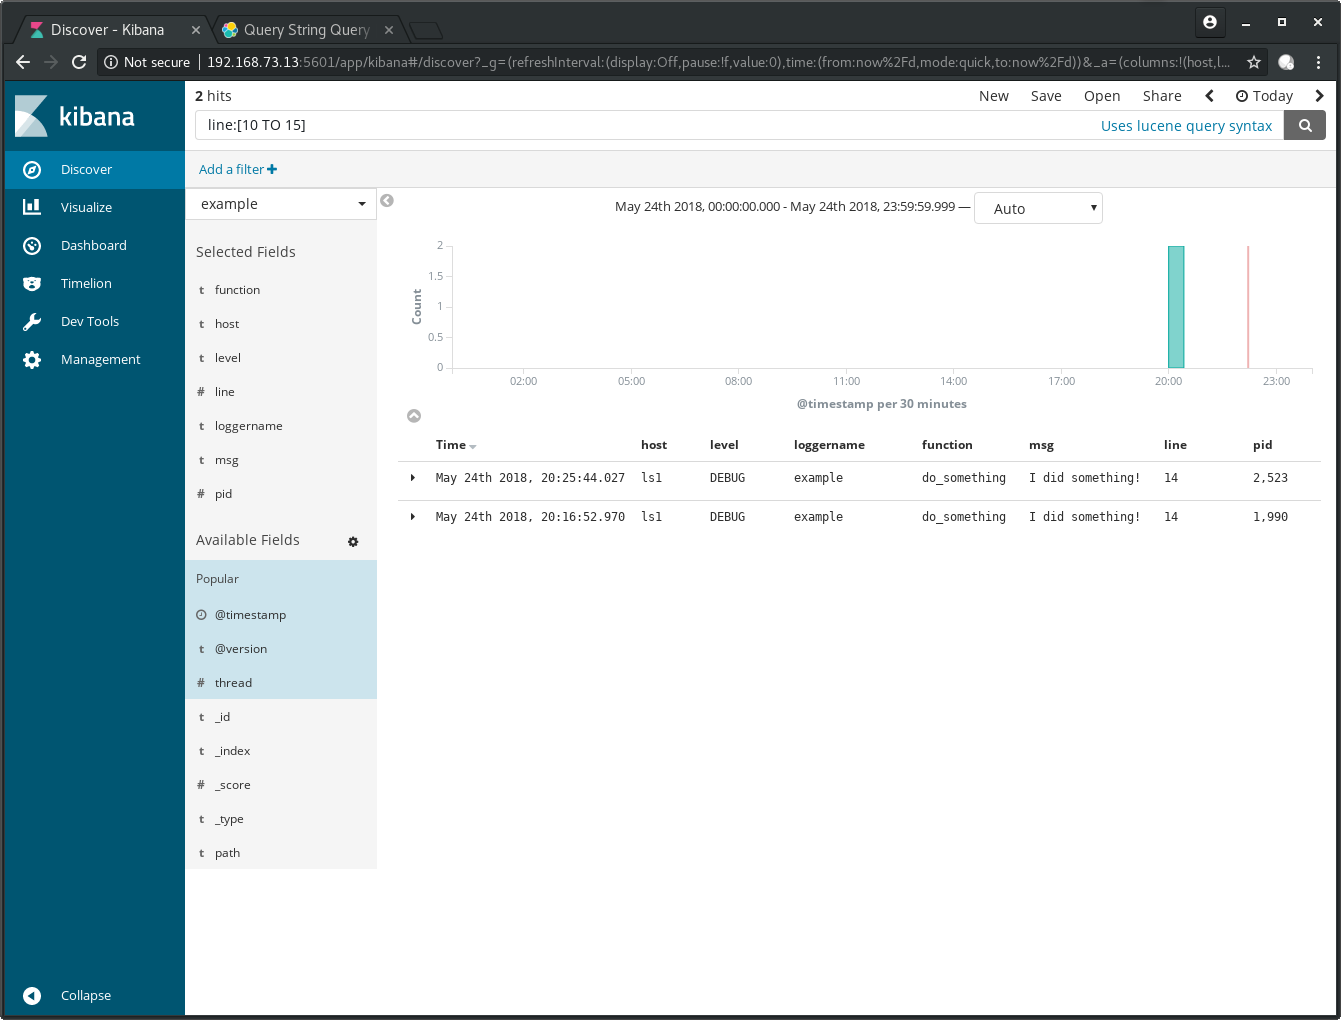
A search with ranges can also be done. Search with
line:[10 TO 15] for all log entries which are created in the
code between lines 10 to 15:
These are fairly simple examples to help understand the basic idea behind it. A more realistic data source to practice with can be found at [5] which contains all logs from the continuous integration tooling of the OpenStack community.
Summary and outlook
This post showed how to set up Kibana on an existing Elasticsearch data store to
search for log entries an example application was producing. A few
example queries with the Lucene search query showed how you can
build search terms to find the log entries most important to you.
The information how to setup these services can be found in the
project source files.
What I didn’t show here, and which will be the content of part 2 in a follow-up post, are:
- ways to save your queries,
- create visualizations and dashboards in the UI
- store them in your code repository of choice.
References
| [1] | https://www.elastic.co/guide/en/kibana/6.2/index.html |
| [2] | https://www.vagrantup.com/docs/installation/ |
| [3] | https://www.virtualbox.org/wiki/Downloads |
| [4] | https://www.elastic.co/guide/en/elasticsearch/reference/6.x/query-dsl-query-string-query.html#query-string-syntax |
| [5] | http://logstash.openstack.org/ |